Whether you’re in sales or marketing, you’ll have been impacted by COVID-19 in some way. But how do your experiences fare compared to the wider industry? Where can you look for benchmark data and what insights can you draw from it?
Rewind ten weeks or so, and the notion that governments around the world would shortly be imposing national lockdowns was implausible. Since then, more than 4.5 billion people — half the world's population — have been living under some form of social distancing measures.
As you’ve likely already felt, these restrictions have had a direct impact on the global economy. But you need more than feelings to understand the enormity of the impact and how to respond to it. Without historical data to lean on, you must look to other sources for data you can use to inform your inbound marketing strategies.
In this article, you’ll find out what the data is telling us about how the global epidemic is disrupting sales and marketing and what insights we can glean from this.
- Uncover benchmark performance data across key sales and marketing metrics
- Find out where to renew your focus in response to the disruption
In part two, we provide a step-by-step guide to pivoting your strategy quickly and efficiently to reflect some of the trends explored below. Read it here.
NOTE:
These insights are based on aggregated data from over 70,000 HubSpot customers globally. The dataset includes weekly trend data for core business metrics in 2020, focusing on changes occurring during and after March 2020. The data from HubSpot’s customer base reflects benchmarks for companies that have invested in an online presence and use inbound marketing as a key part of their growth strategy. Because the data is aggregated from HubSpot customers’ businesses, please keep in mind that individual businesses may differ based on their own markets, customer base, industry, geography, stage, and/or other factors.
How the global pandemic is impacting deal pipelines
It will come as no surprise that deal pipelines were hit hard when the restrictions began coming into effect. We can see the reported numbers around this by looking at new deals created and new deals closed between now and mid-March, when the COVID-19 was officially declared a global pandemic by WHO and restrictions came into play in force.
In an analysis of over 70,000 companies, growth platform HubSpot reports that the weekly average deals created across all industries decreased globally by 17% the week of March 16th and fell 21% by the week of March 30th compared to pre-COVID benchmark data.
This decline appeared to peak by April 6th at -30%, the same week that the number of new deals marked as closed hit -36%, quantifying what many of us already knew at the time — prospects were not buying.
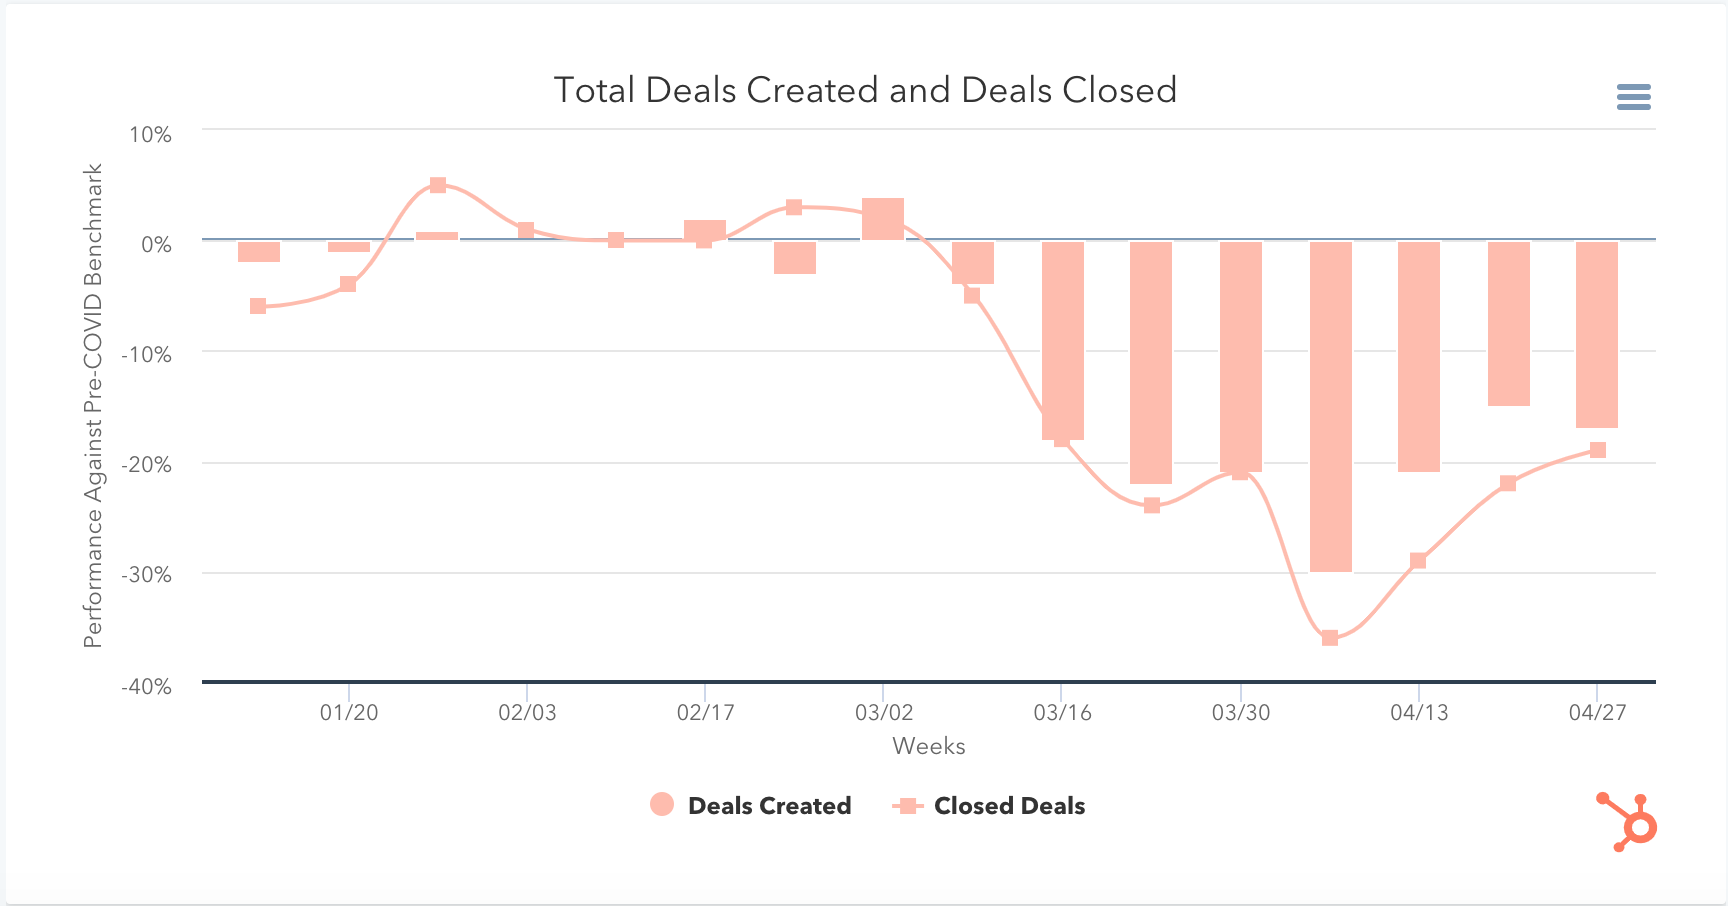
Image from HubSpot
During these weeks, the spread and severity of social distancing measures continued to grow, limiting many people’s abilities to work and shop and grounding some industries altogether. It’s likely that the speed of the developments, alongside widespread uncertainty and risk, brought buyer confidence low, leaving many prospects unwilling or unable to commit spending.
As many organisations around the world begin forming new routines, this has started to improve, with deals closed reportedly increasing 9% week on week as of May 4th, but this is still 22% lower than pre-COVID averages.
The effectiveness of your sales emails
With new deals and deals closed dropping, there’s been a marked increase in the number of sales emails going out as reps around the world battle to minimise losses and hit their targets.
In fact, by the end of March, sales email sends were up 61%. This increased stayed above 50% pre-COVID benchmark levels throughout April, actually peaking in the week of April 20th at 67%.
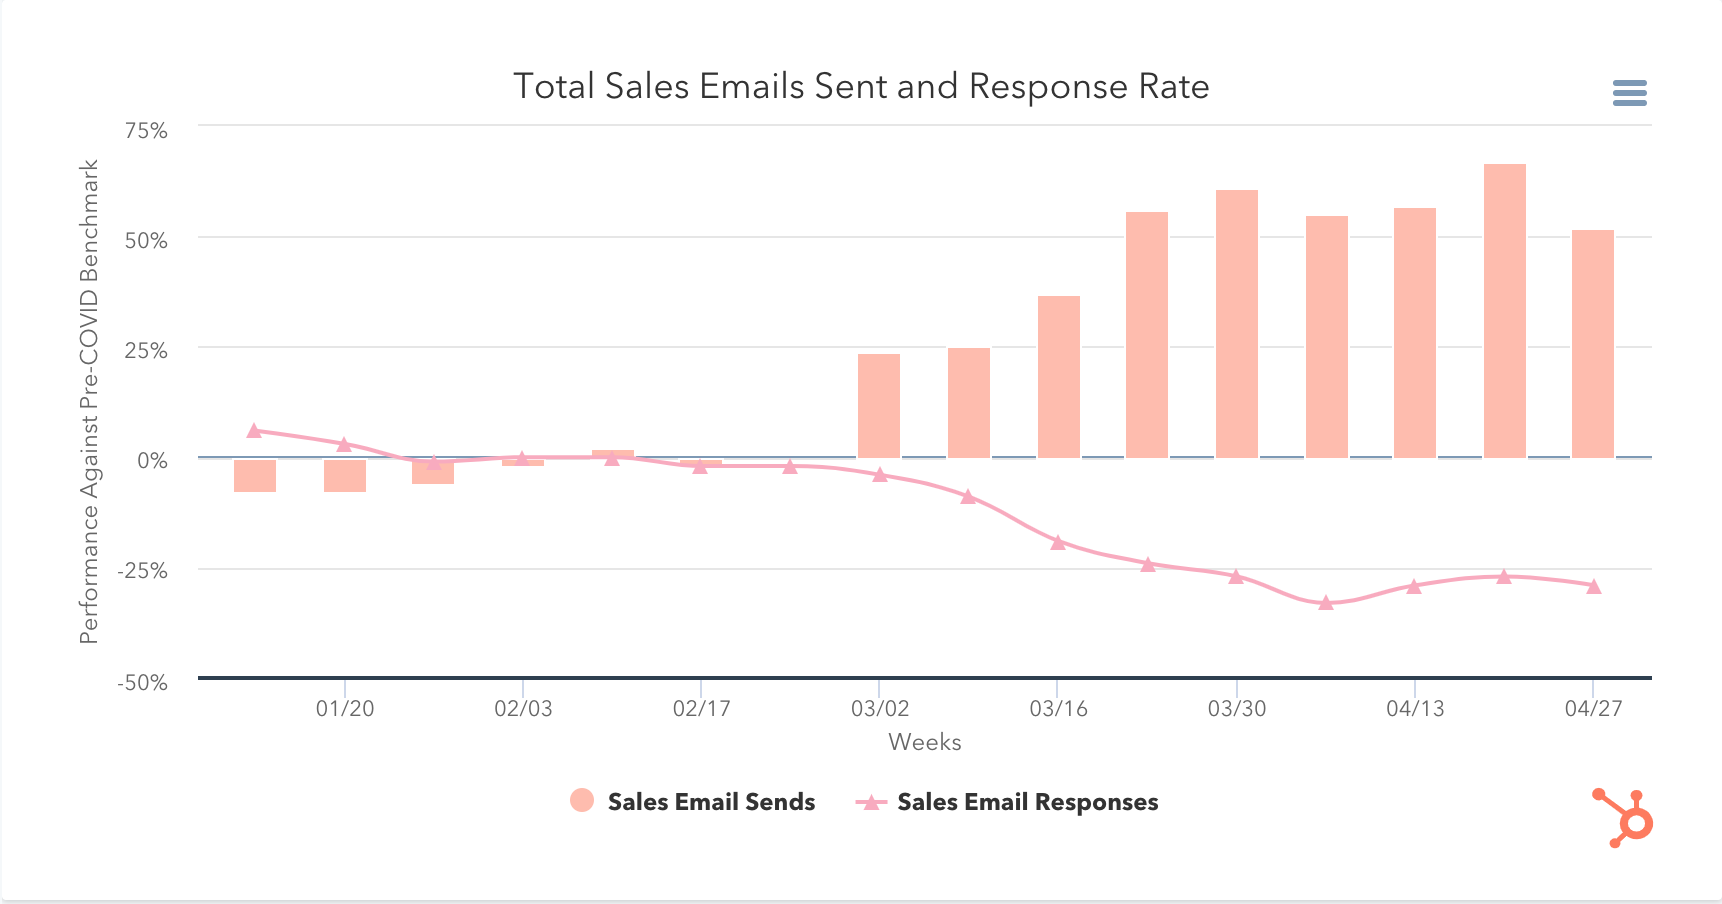
Image from HubSpot
Of interest is the relationship between sales email sends and sales email responses. Given what we’ve learned about buying behaviour over the period of March and April, you’d likely be surprised if sales teams were seeing much uptake off the back of these communications, and you’d be correct — by the week of April 6th, sales email responses were down 33%, marking a steady descent since the start of March.
While this appears to have stabilised across April, you can see from the image shared above that it’s done so around -25% compared to pre-COVID benchmark levels, reinforcing the disruptive impacts the pandemic appears to have had on buying behaviour.
The impact of the pandemic on inbound marketing emails
Sales has spent much of March and April fighting to hold its own, but what of marketing?
Interestingly, HubSpot reported increased marketing email open rates of 22% for the week of March 16th, despite marketing email volume going up by 32%. Since that first peak, marketing email sends have followed a slight downward trend, 25% up on pre-COVID benchmark levels for the week of April 20th and 27% up as of the week of April 27th, suggesting that while the initial flurry of marketing outreach — “we’re still here and we’re still open!” — has cooled, the marketing team is still working hard to keep communications open.
But what are they saying, and how is that being received?
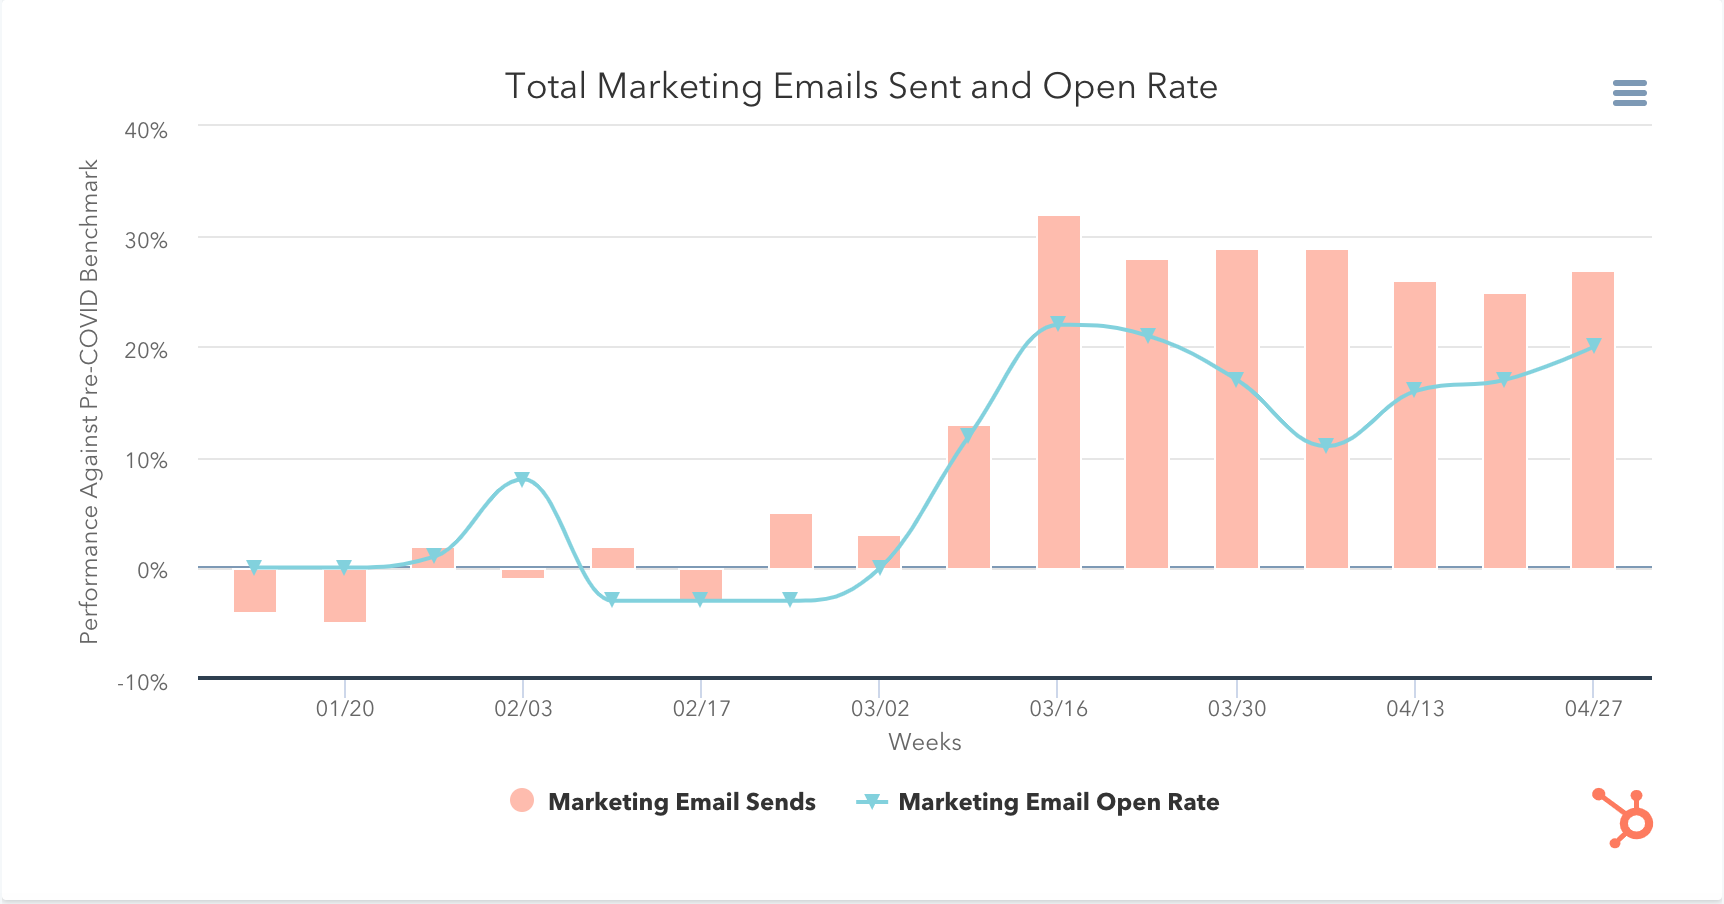
Image from HubSpot
In the graph shared above, you can see a significant dip in marketing email open rates reported for the week of April 6th, preceded by a steady decline from March 16th. We could infer from this that while marketing email sends peaked that initial week, the content of those emails tired quickly or did not strike the right tone in response to the crisis.
How many brands fired off overtly promotional emails when we can see deals and sales response rates falling? How many sought to jump on the remote working topic of discussion, which for a brief moment flared so hot before becoming lost in a sky’s worth of similar content?
With marketing email open rates on the increase again, it would appear as though many teams have switched up their messaging or found their feet in order to deliver emails of much more value and relevance, at a time when the database appears hungry to learn.
Benchmark website traffic
At face value, website traffic appears to have increased for many of the organisations surveyed. The beginning of March signals an upward trend, with website visitors up 4% for the week of March 2nd and rising steadily to a 24% increase on pre-COVID benchmark levels as of April 24th.
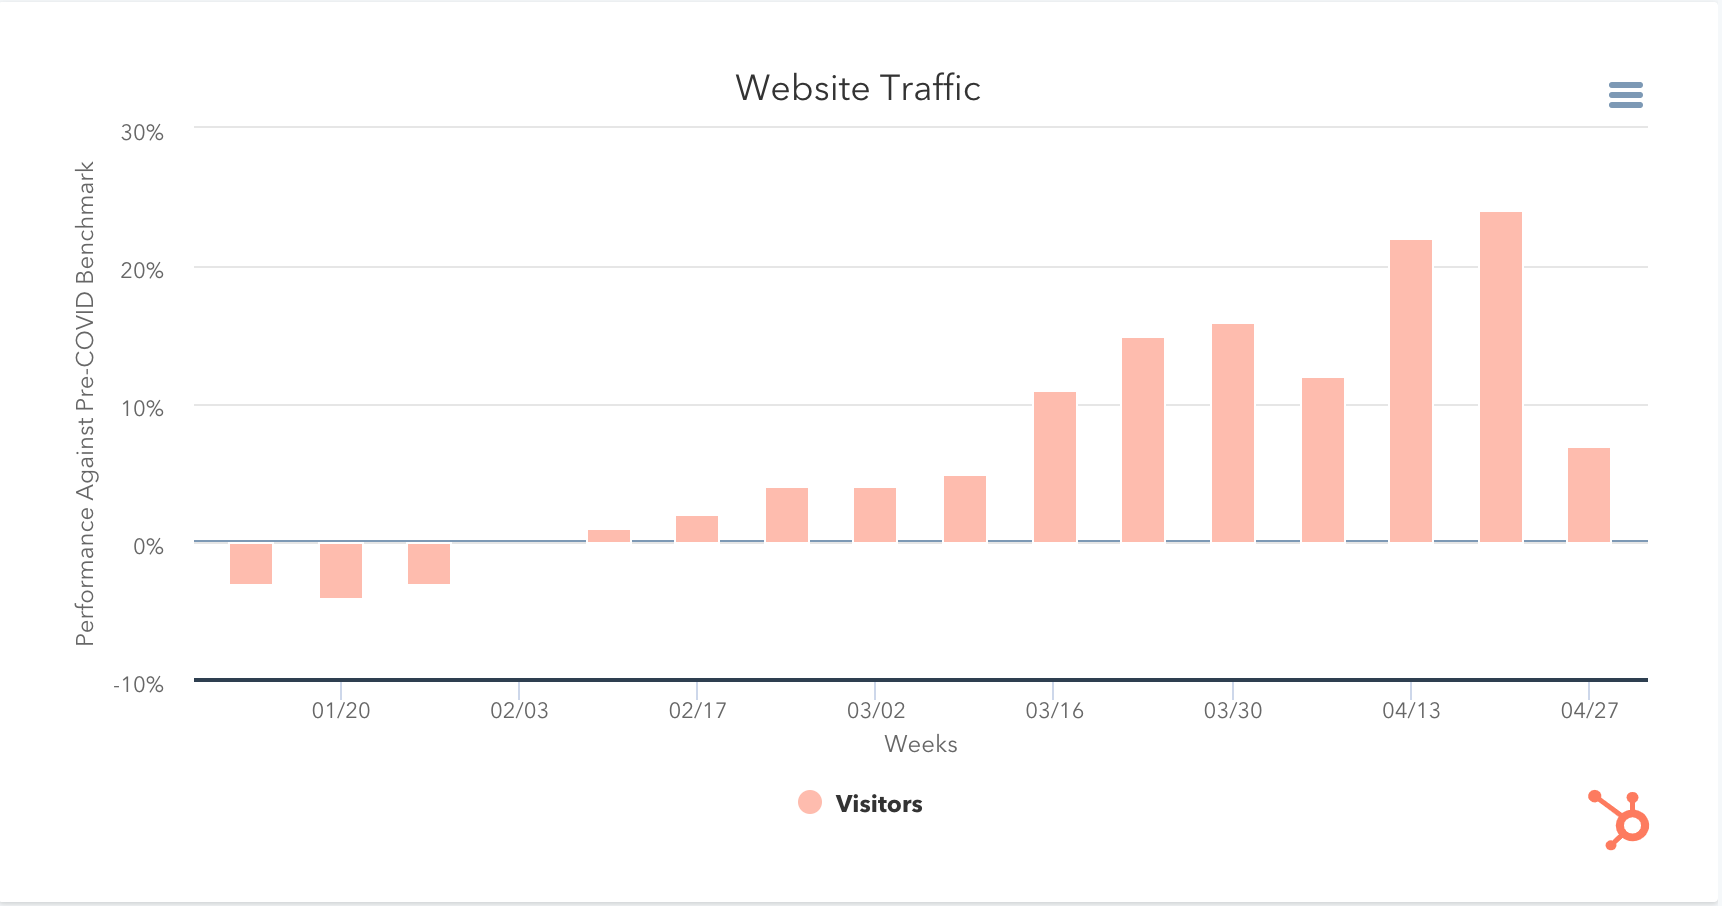
Image from HubSpot
But the picture is not this clear. By the week of April 27th, you can see this plummet to just 7% above pre-COVID benchmark levels. Digging deeper into the data reveals the startling disparity between website traffic across industries, with travel and human resources in particular taking huge hits (-41% for travel in the week of March 30th and -23% for HR for the week of April 6th).
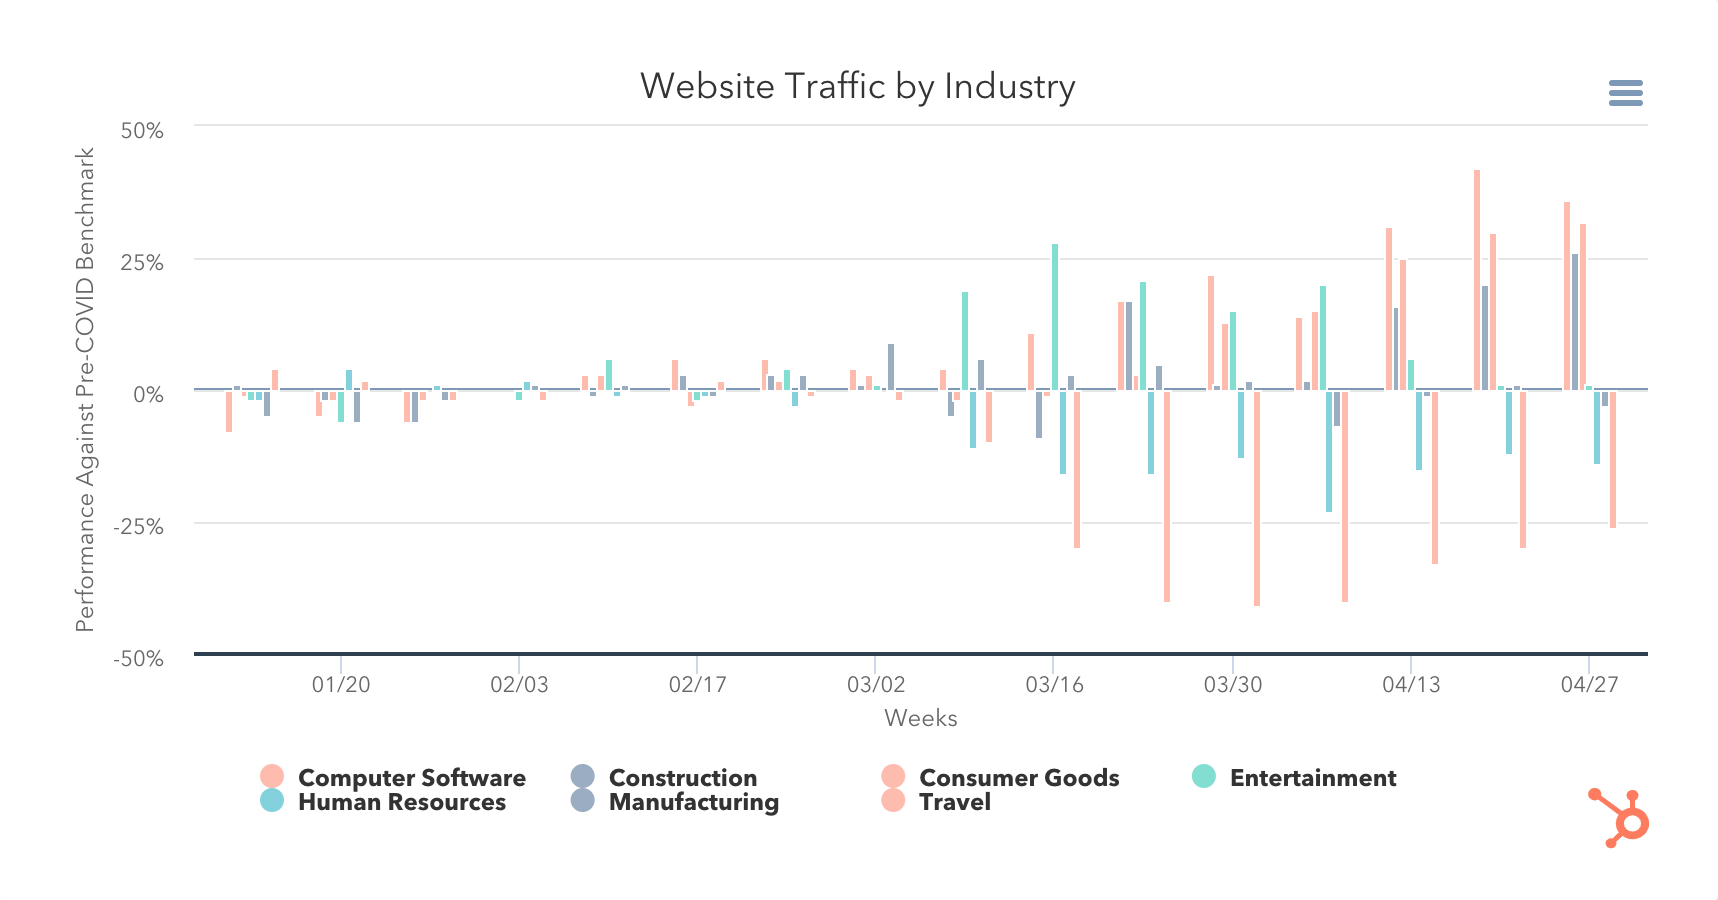
Image from HubSpot
While this is not surprising in itself, it does skew the data for organisations that have seen increases in traffic (see image above), suggesting that for meaningful insights, you’re best placed to review your specific industry to see how it has been affected. At time of writing:
- Computer software has seen a progressive increase in website traffic, peaking at 42% for the week of April 20th
- Construction has seen a slow increase in website traffic, picking up in April and currently peaking at 26% up for the week of April 27th
- Consumer goods has seen increased traffic throughout April, also peaking for the week of April 27th at 32% up
- Entertainment saw significantly increased website traffic throughout March, peaking at 28% up for the week of March 16th, although this has since trailed off to 1% by the end of April.
- Human resources, as we’ve mentioned, has seen decreased traffic (see above)
- Manufacturing’s website traffic has seen minimal impact either way, with a peak of 9% (week of March 23rd) and a trough of 7% (week of April 6th) variously
- Travel we have also already referenced above
For those industries seeing positive impacts in the form of website visitors, it’s worth considering the impact of this increased traffic vs the loss of footfall to any brick-and-mortar shops as a result of the restrictions (particularly relevant for B2C organisations). Increased traffic could suggest your prospects and customers are turning online to research or buy your offerings, a timely opportunity to review your online presence/digital marketing strategy to maximise conversions and cement new behaviours in audiences who might previously have shopped in person.
The state of conversations
By conversations, we’re talking about HubSpot’s live chat and chatbot solutions — in-built messaging tools that many of its users have adopted in order to have personalised conversations with prospects and customers at their convenience.
From midway through March, we can see those interactions increasing consistently on pre-COVID benchmark levels, rising from a 4% increase in the week of March 16th right up to a 26% increase by the week of April 27th.
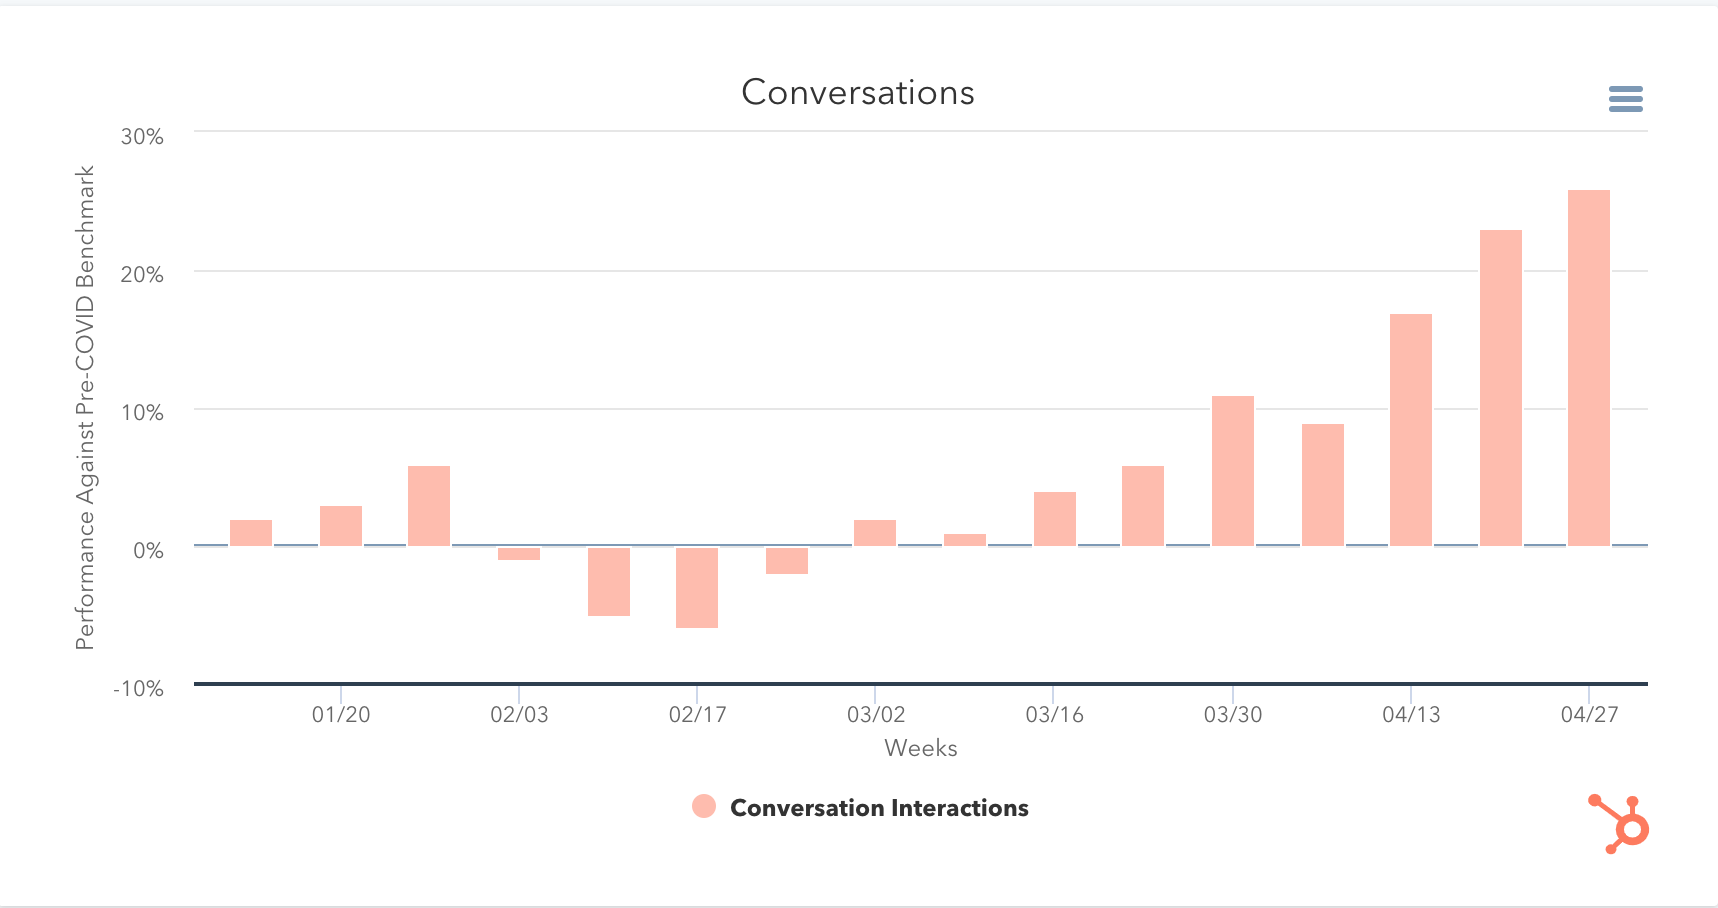
Image from HubSpot
When we think about how these messaging tools are primarily used — to answer user questions quickly and in real-time — it is not unreasonable to infer that your website visitors have more questions than ever before. When you compare this to the increasing marketing email open rates we explored earlier in this article, it’s fair to say that many of the people visiting your websites and engaging with your marketing are looking to you for guidance and advice now more than ever.
For a clearer idea of what these questions are in the context of your organisation, you’ll need to review your own HubSpot instance (or set up the tools to start gathering the data now, if you haven’t already).
What we can say, based on all the accumulated data across these metrics, is that a revised sales and marketing strategy prioritising learning and education across the buyer’s journey seems like an effective way to juggle your dual responsibilities. Such an approach would enable you to genuinely help the buyer to get the answers they need and feel more confident throughout this challenging time while continuing to serve the business through lead generation and nurturing.
Get an industry breakdown of all the metrics we’ve referenced using HubSpot’s COVID-19 Benchmark Data tool.
How has the pandemic impacted your inbound marketing?
The situation continues to move fast. Agility will be key to adapting in these challenging times, and those who are able to pivot accordingly will gain their customers’ trust. But pivoting safely and effectively is no small feat, particularly when most of us simply don’t have the data to make objective decisions.
We hope some of the benchmark data HubSpot has compiled over the recent weeks has helped you to measure how your organisation or department is faring and make more confident decisions about how to proceed with your sales or marketing strategy, so you can continue to hit your objectives and support your organisation in the coming months.
Keen to review your marketing strategy in response to the situation but don’t know where to start? Read part two now, where we provide a step-by-step guide to pivoting your strategy quickly and efficiently to meet these new buyer expectations.