Why It's Useful
- Lead volume alone doesn’t give you the full picture. This hack allows you to:
Evaluate the quality of leads over time - Understand how fast leads move through the funnel (speed)
- Identify how many convert (rate)
- Improve decision-making around training, content, or handover processes
- It enables you to optimise the system around your leads—not just increase spend.
How to Implement It
Step 1: Create a Calculated Property
Navigate to Settings > Properties > Create Property under Contacts
- Label e.g.: timeFromMQLToSQL
- Field type: Calculation property
- Calculation type: Time between
- Number format: Duration
- Start date: Date entered Marketing Qualified Lead
- End date: Date entered Sales Qualified Lead


Step 2: Build the Report
Go to Reports > Create Report > Custom Report Builder
Choose Contacts as the data source
Filters:
- Lifecycle stage is any of MQL or SQL
- timeFromMQLToSQL is known (optional, but useful to exclude blanks
- Use Date entered Sales Qualified Lead
- Group by month
- Use the calculated property: timeFromMQLToSQL
- Set aggregation to Average (not Sum)

This setup will show how long on average leads take to move from MQL to SQL, grouped by the month they became SQL.
Step 3: Add a Conversion Rate View
To get the full view of pipeline velocity, you can also create a second report (or a table widget in a dashboard) to show:
- MQLs created per month
- SQLs created per month
- Conversion rate: MQL to SQL
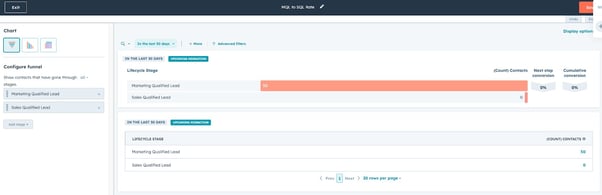
This helps you track both how fast leads move and how many make it through—your true pipeline velocity.
Additional Tips
- Consider adding segmentation by original source or contact owner to uncover deeper insights
- Use in a dashboard alongside:
- Leads created in the last 30 days
- Average lead response time
- Sales activity counts
- MQL to SQL rate and speed
- Monitor changes over time to spot seasonality, campaign impact or sales enablement gaps
By Carl Griffiths