- conversion rate
- bounce rate
- average session duration
When building a basic CRO dashboard for our clients we like to separate it out into an overview, website pages, landing pages, and blogs so that at a glance you can see the data you need. A feature we also make use of is the ability to insert text into your dashboard. You can do this by clicking the 'Actions' dropdown on the top right of the dashboard, and selecting 'Add images text or video'.
Overview:
In the overview section of the dashboard you need to be highlighting which sources are generating conversions and this report does exactly that. You can find this by going to Reports > Analytics tools > Traffic Analytics > Save report :
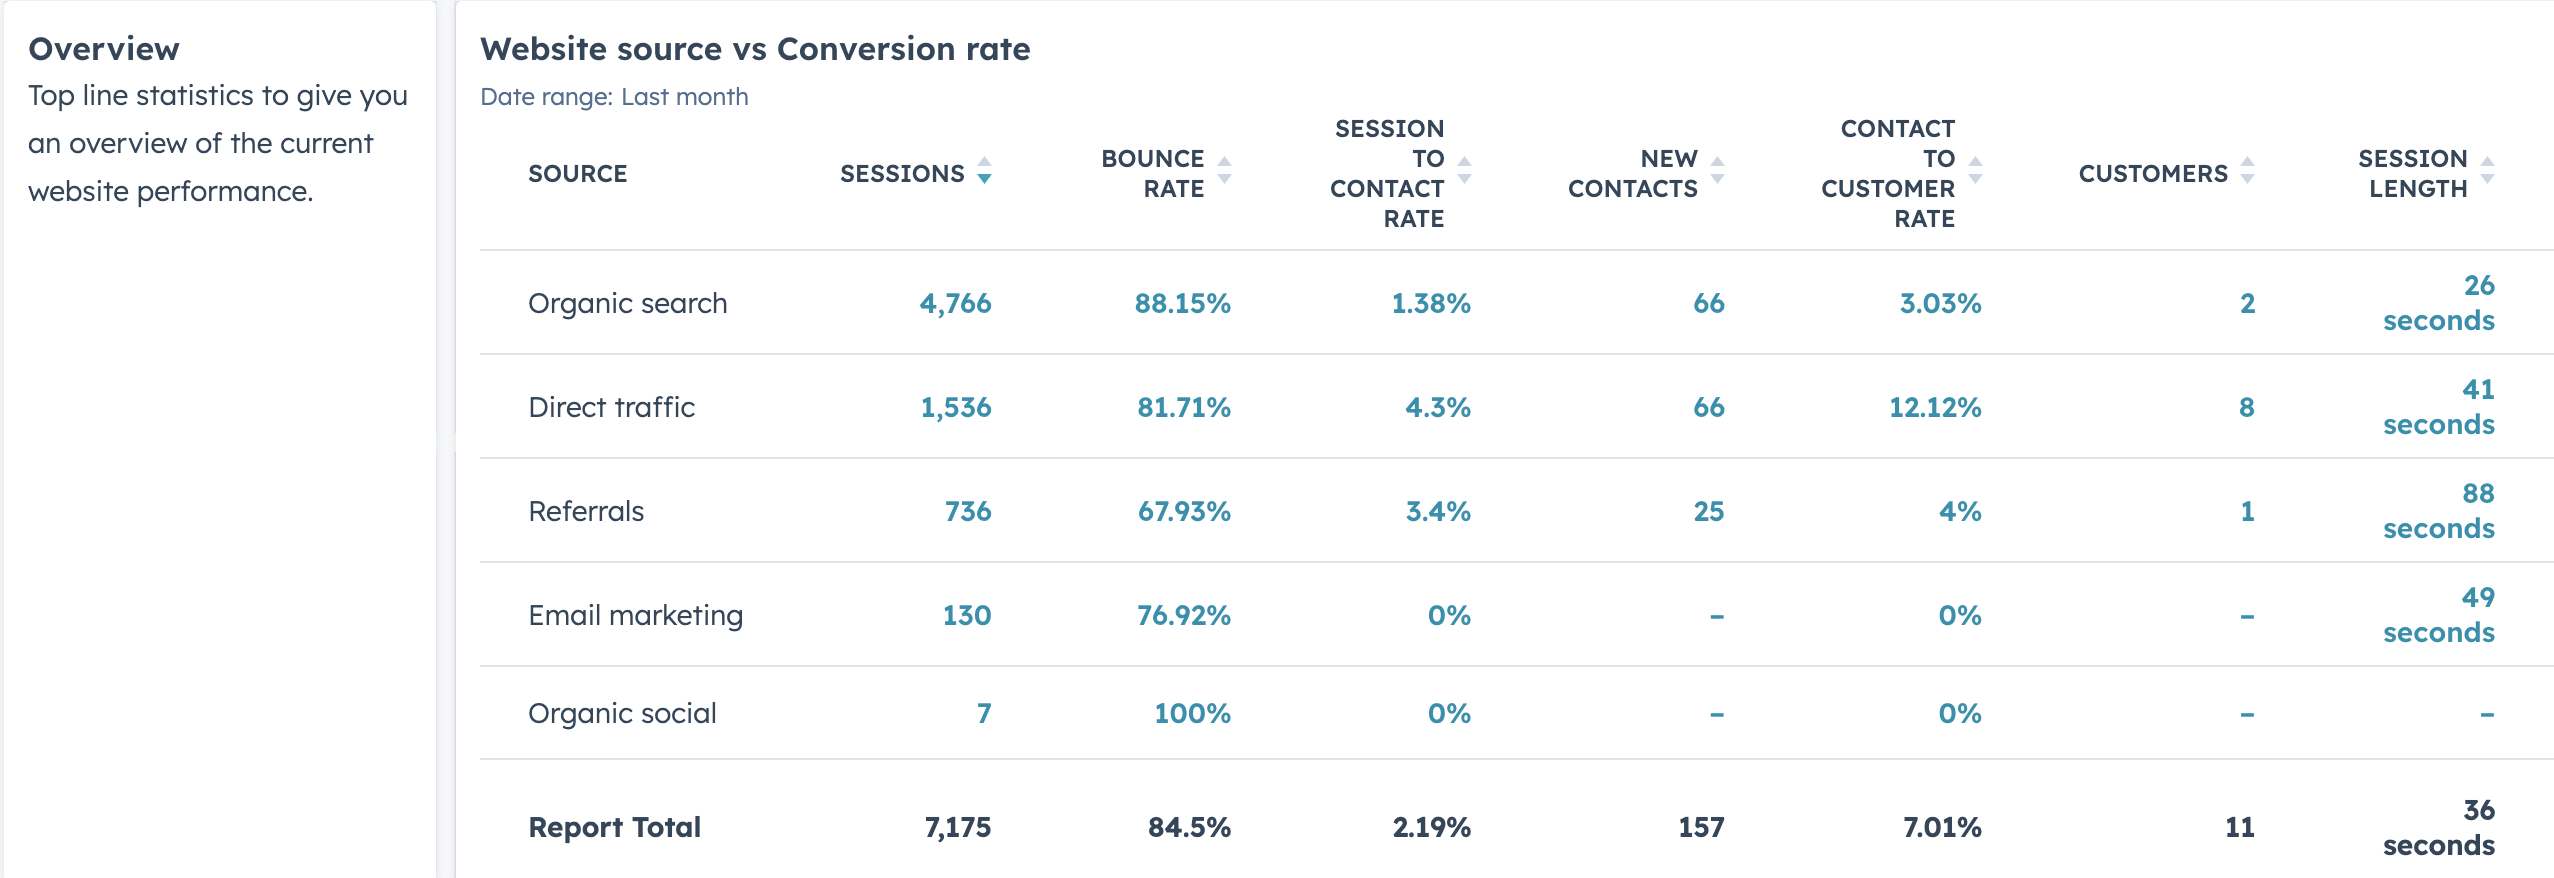
You can easily see the conversion rate, customer conversion rate, bounce rate and session length in one glance. If you have specific goals for each of these that you'd like to compare where you're at against, we advise to add this into the paragraph section on the left. That way you don't need to refer back to another document to get that information.
Next, you want to have some reports on the forms you're using across the website. This will help identify which forms aren't performing and where you can put time in to improve. Here are two examples, please note we have removed the form titles for privacy. Again these are standard forms which you can find in Analytics > Reports > Search forms:
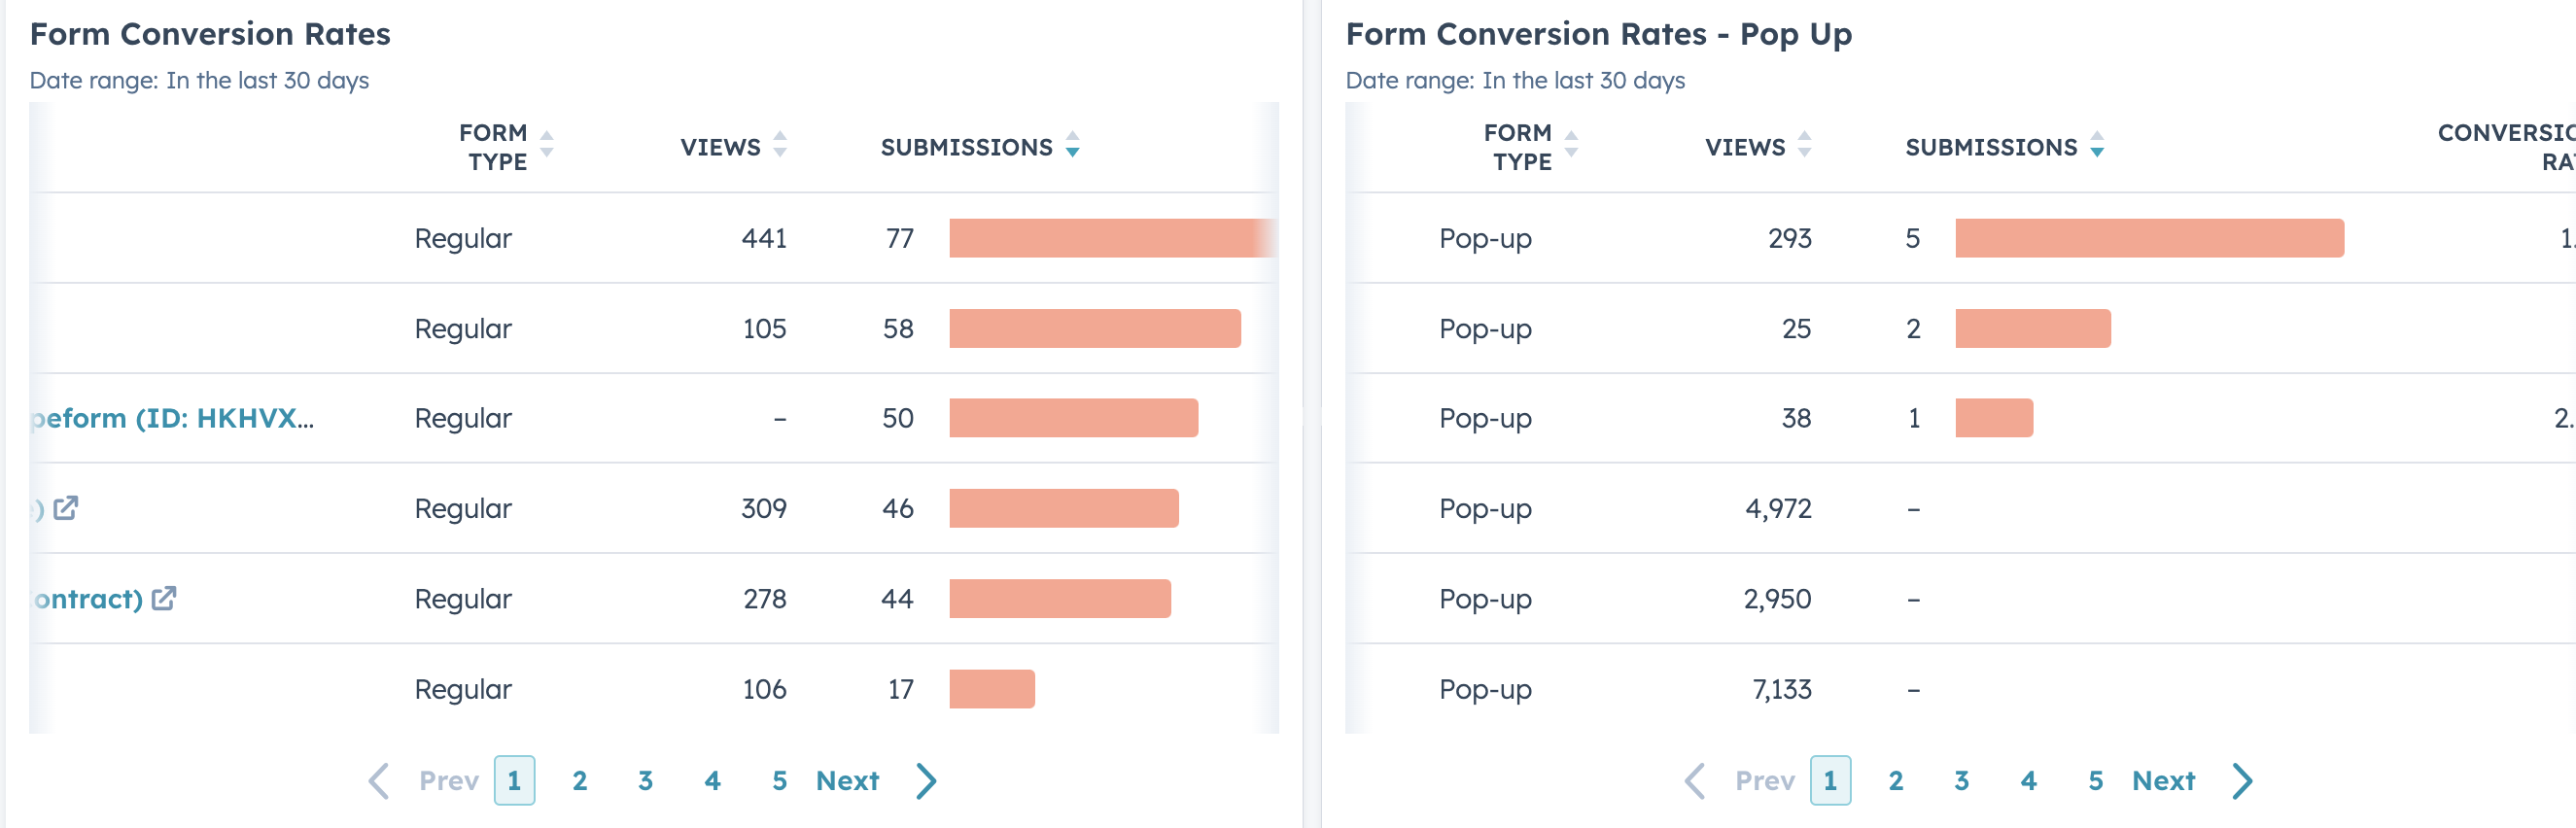
We have filtered this report to identify regular embedded forms which would include the contact us form, and then the pop-up forms which are across the website. This is because you can expect to get a much lower conversion rate on pop-up forms due to their visibility being much higher.
Website pages
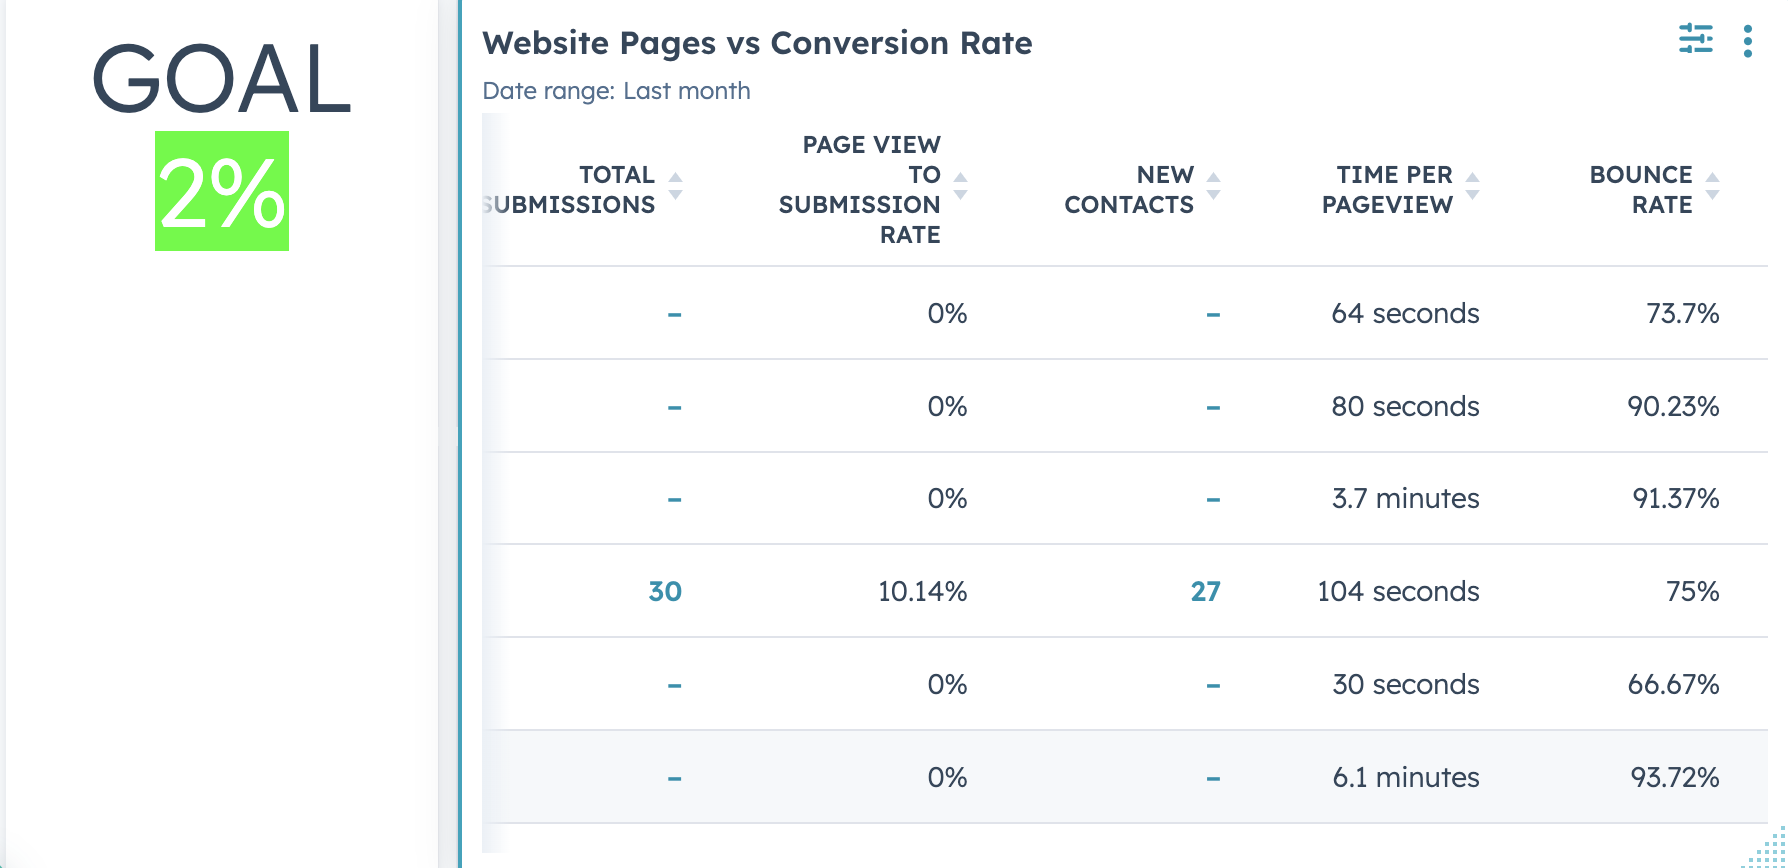
For the website pages you want to be aiming for a minimum of 1% conversion rate but 2% is what we recommend as ideal. Using the below form you can again view conversion/submission rate, time per page and the bounce rate. We've also included what the goal is on the side so that all members of the team have full visibility of KPIs. To find this report go to Reports > Analytics tools > Traffic analytics > Pages filtered > Website pages > Save report.
We'd also recommend having a report which breaks down all website pages by source. This report is similar to the overview report from the beginning of the dashboard but it is exclusively filtered for website pages.
Landing pages
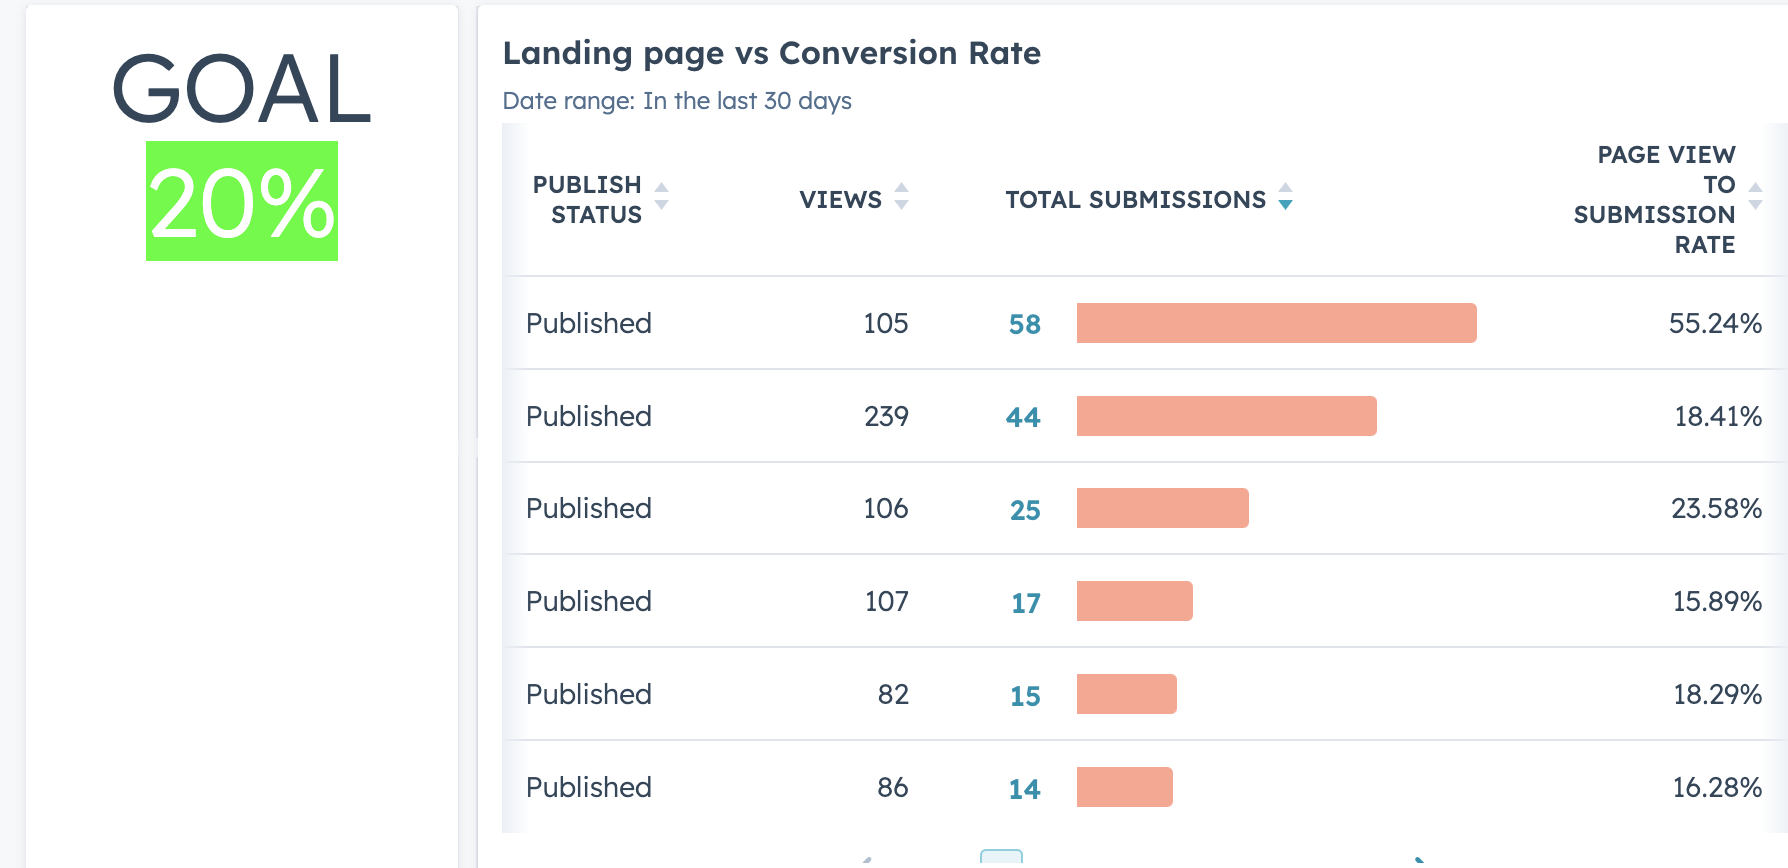
Similarly to website pages, you can have one standard report showing all the key metrics. To find this report go to Reports > Analytics tools > Traffic analytics > Pages filtered > Landing pages > Save report.:
Again, we recommend having a report which breaks down all landing pages by source. This report is similar to the overview report from the beginning of the dashboard but it is exclusively filtered for landing pages.
To find this report for blogs go to Reports > Analytics tools > Traffic analytics > Pages filtered > Blog pages > Save report.
These are the minimum reports you need to keep an eye on your conversion rate but there are also some supporting standard reports which can help too. These include the following:
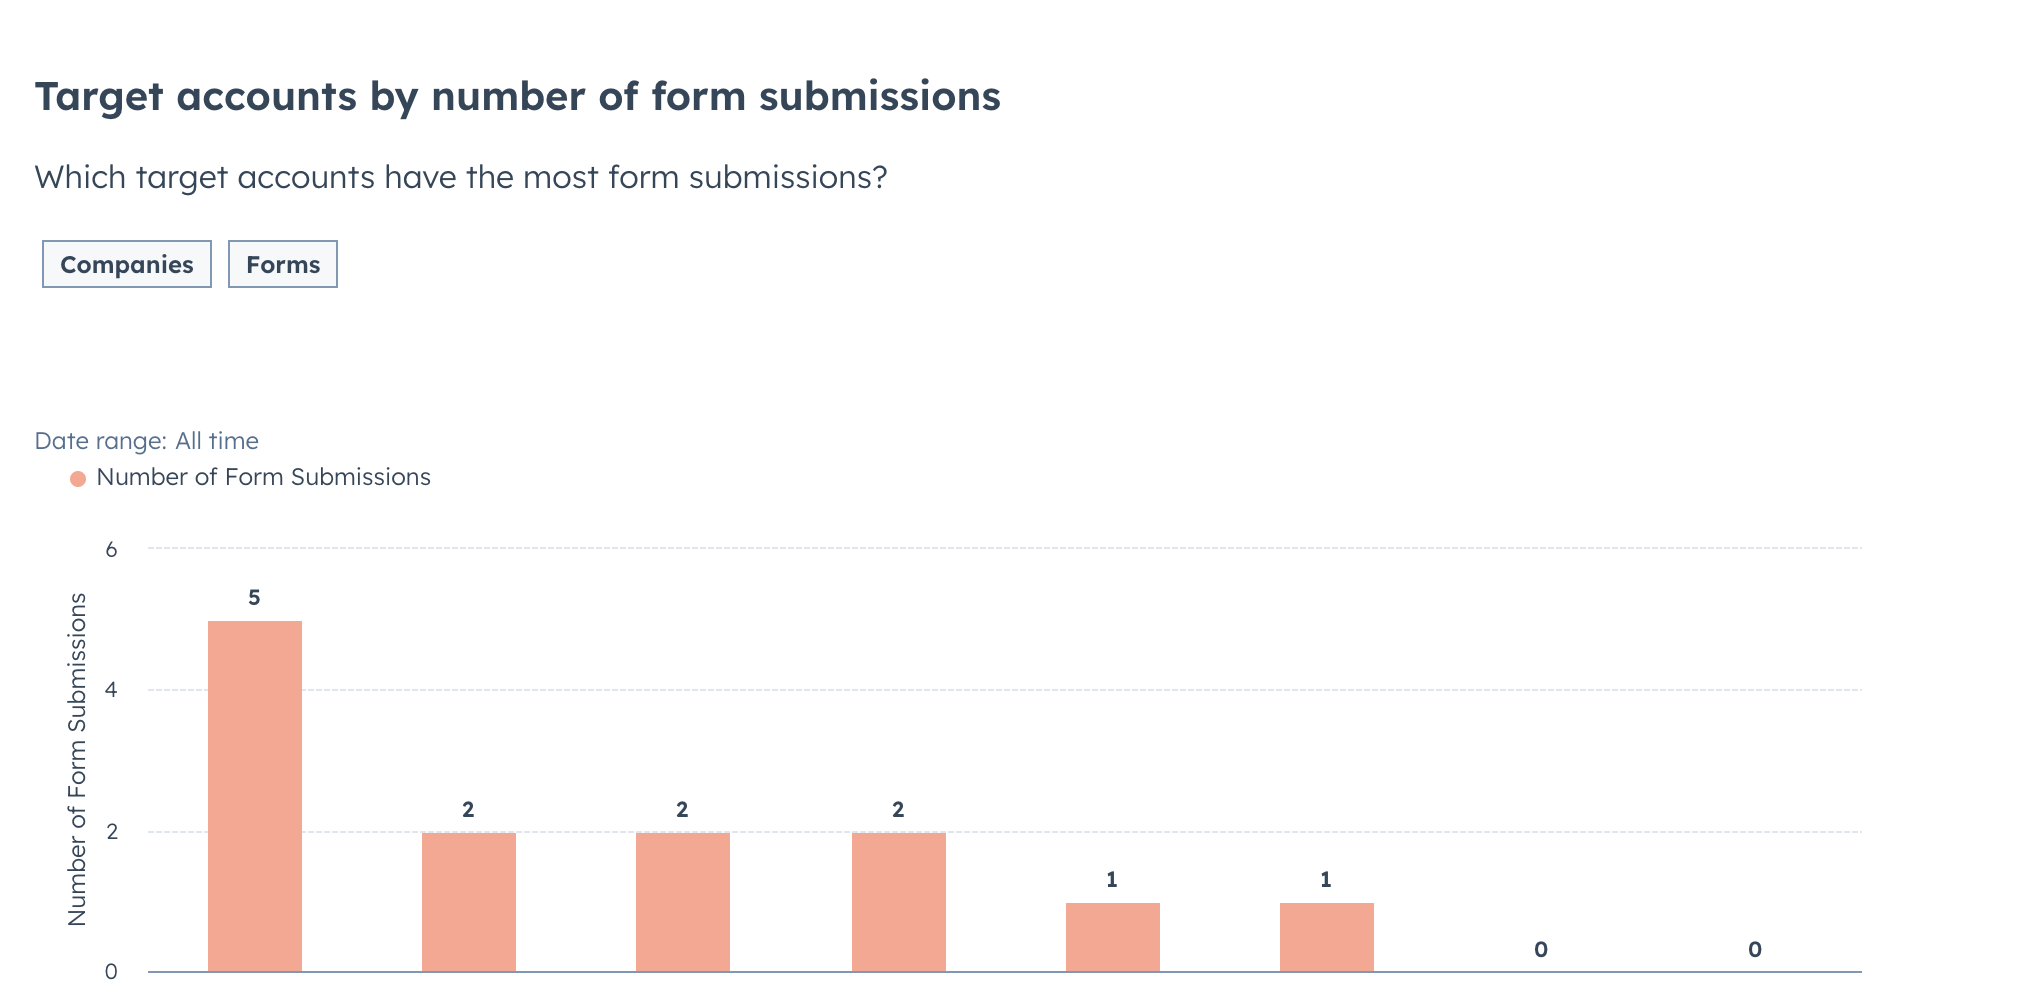
This will show a breakdown of your form submissions to see which of your target accounts are getting in touch and which accounts you need to reach out to more. 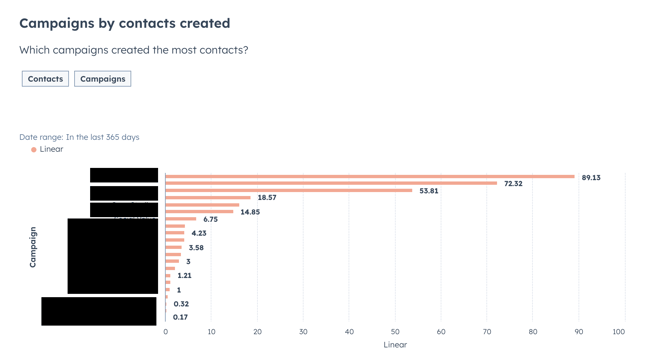
This will show which campaign is generating the most conversions which will help inform where you invest more of your time in future.
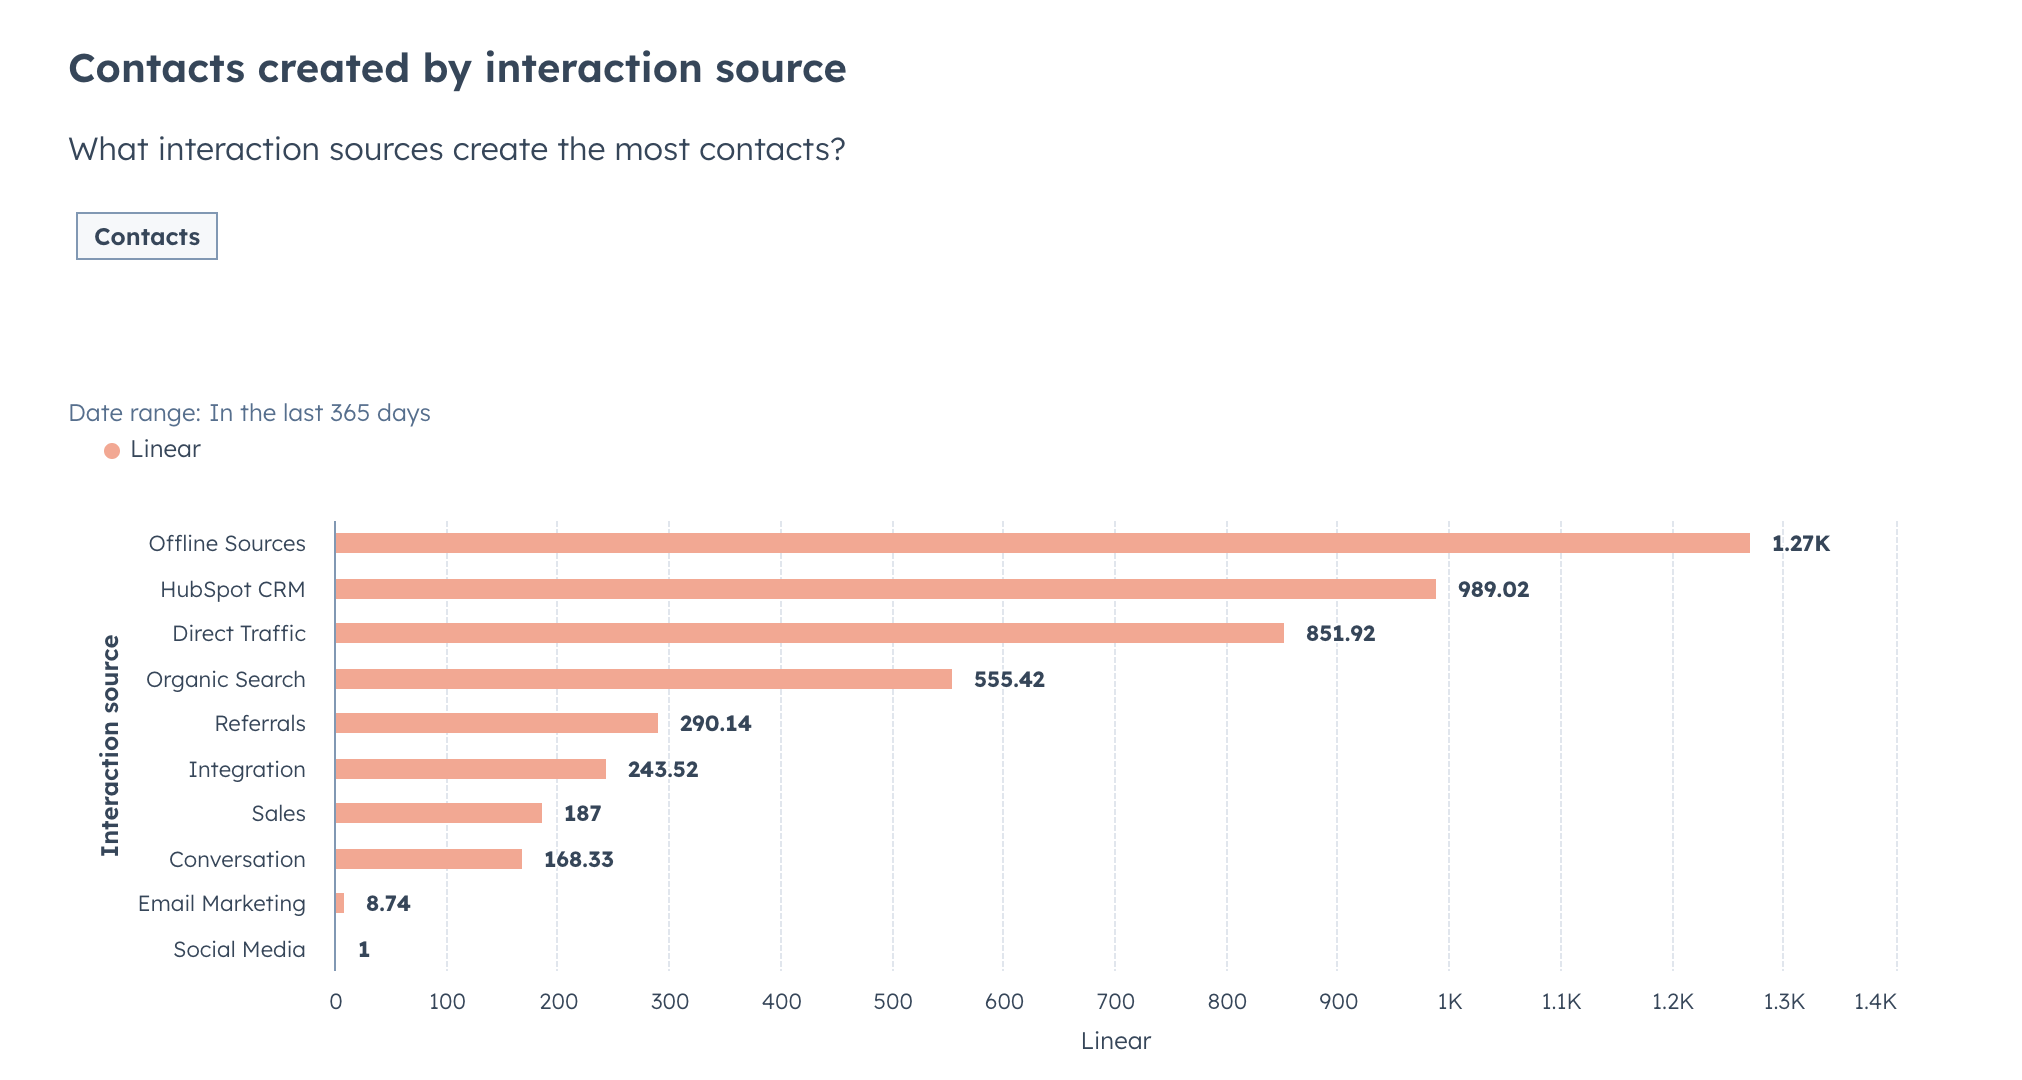
And finally where are these submissions coming from? You should include which source they originated from. For example, in the above we can see that social media has not created a large number of conversions so next quarter we will change the messaging and type of posts we publish to encourage more of this.
In conclusion, you don't need to be an analytics whizz to understand CRO reporting. You just need some standard reports from HubSpot in one place. One last note - it is important you maintain data cleanliness to ensure data accuracy so we recommend to regularly review and refine your CRM.

Author: Bridget Reid
Principal Marketer
