Sales managers and representatives are constantly seeking ways to boost their productivity and achieve better results. That's where the sales cookbook dashboard emerges as a game-changing tool, offering valuable insights into sales behaviour and performance.
At the heart of the sales activity dashboard lies the fundamental principle of tracking and monitoring essential sales metrics. But what does that include and how can you build one?
Step one: Create dashboard
- Click Reports along the top navigation
- Dashboards > Create dashboard > New dashboard
- Name it something appropriate e.g "Sales Cookbook"
- Add report > Create report
- Move to step two
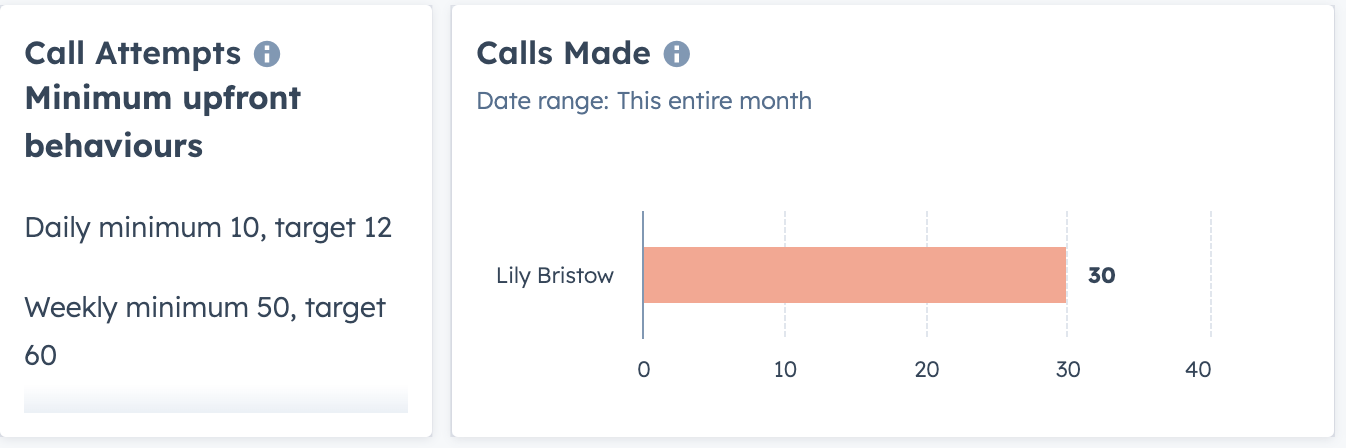
Step two: Calls made report
In this report we are tracking the number of calls made by a sales rep.
- Search "calls placed total by rep"
- Click on report
- Click save
- Click Add to the existing dashboard
Top tip: add in a block of text next to each report to highlight what the minimum upfront behaviour should be so you can quickly compare against the report.
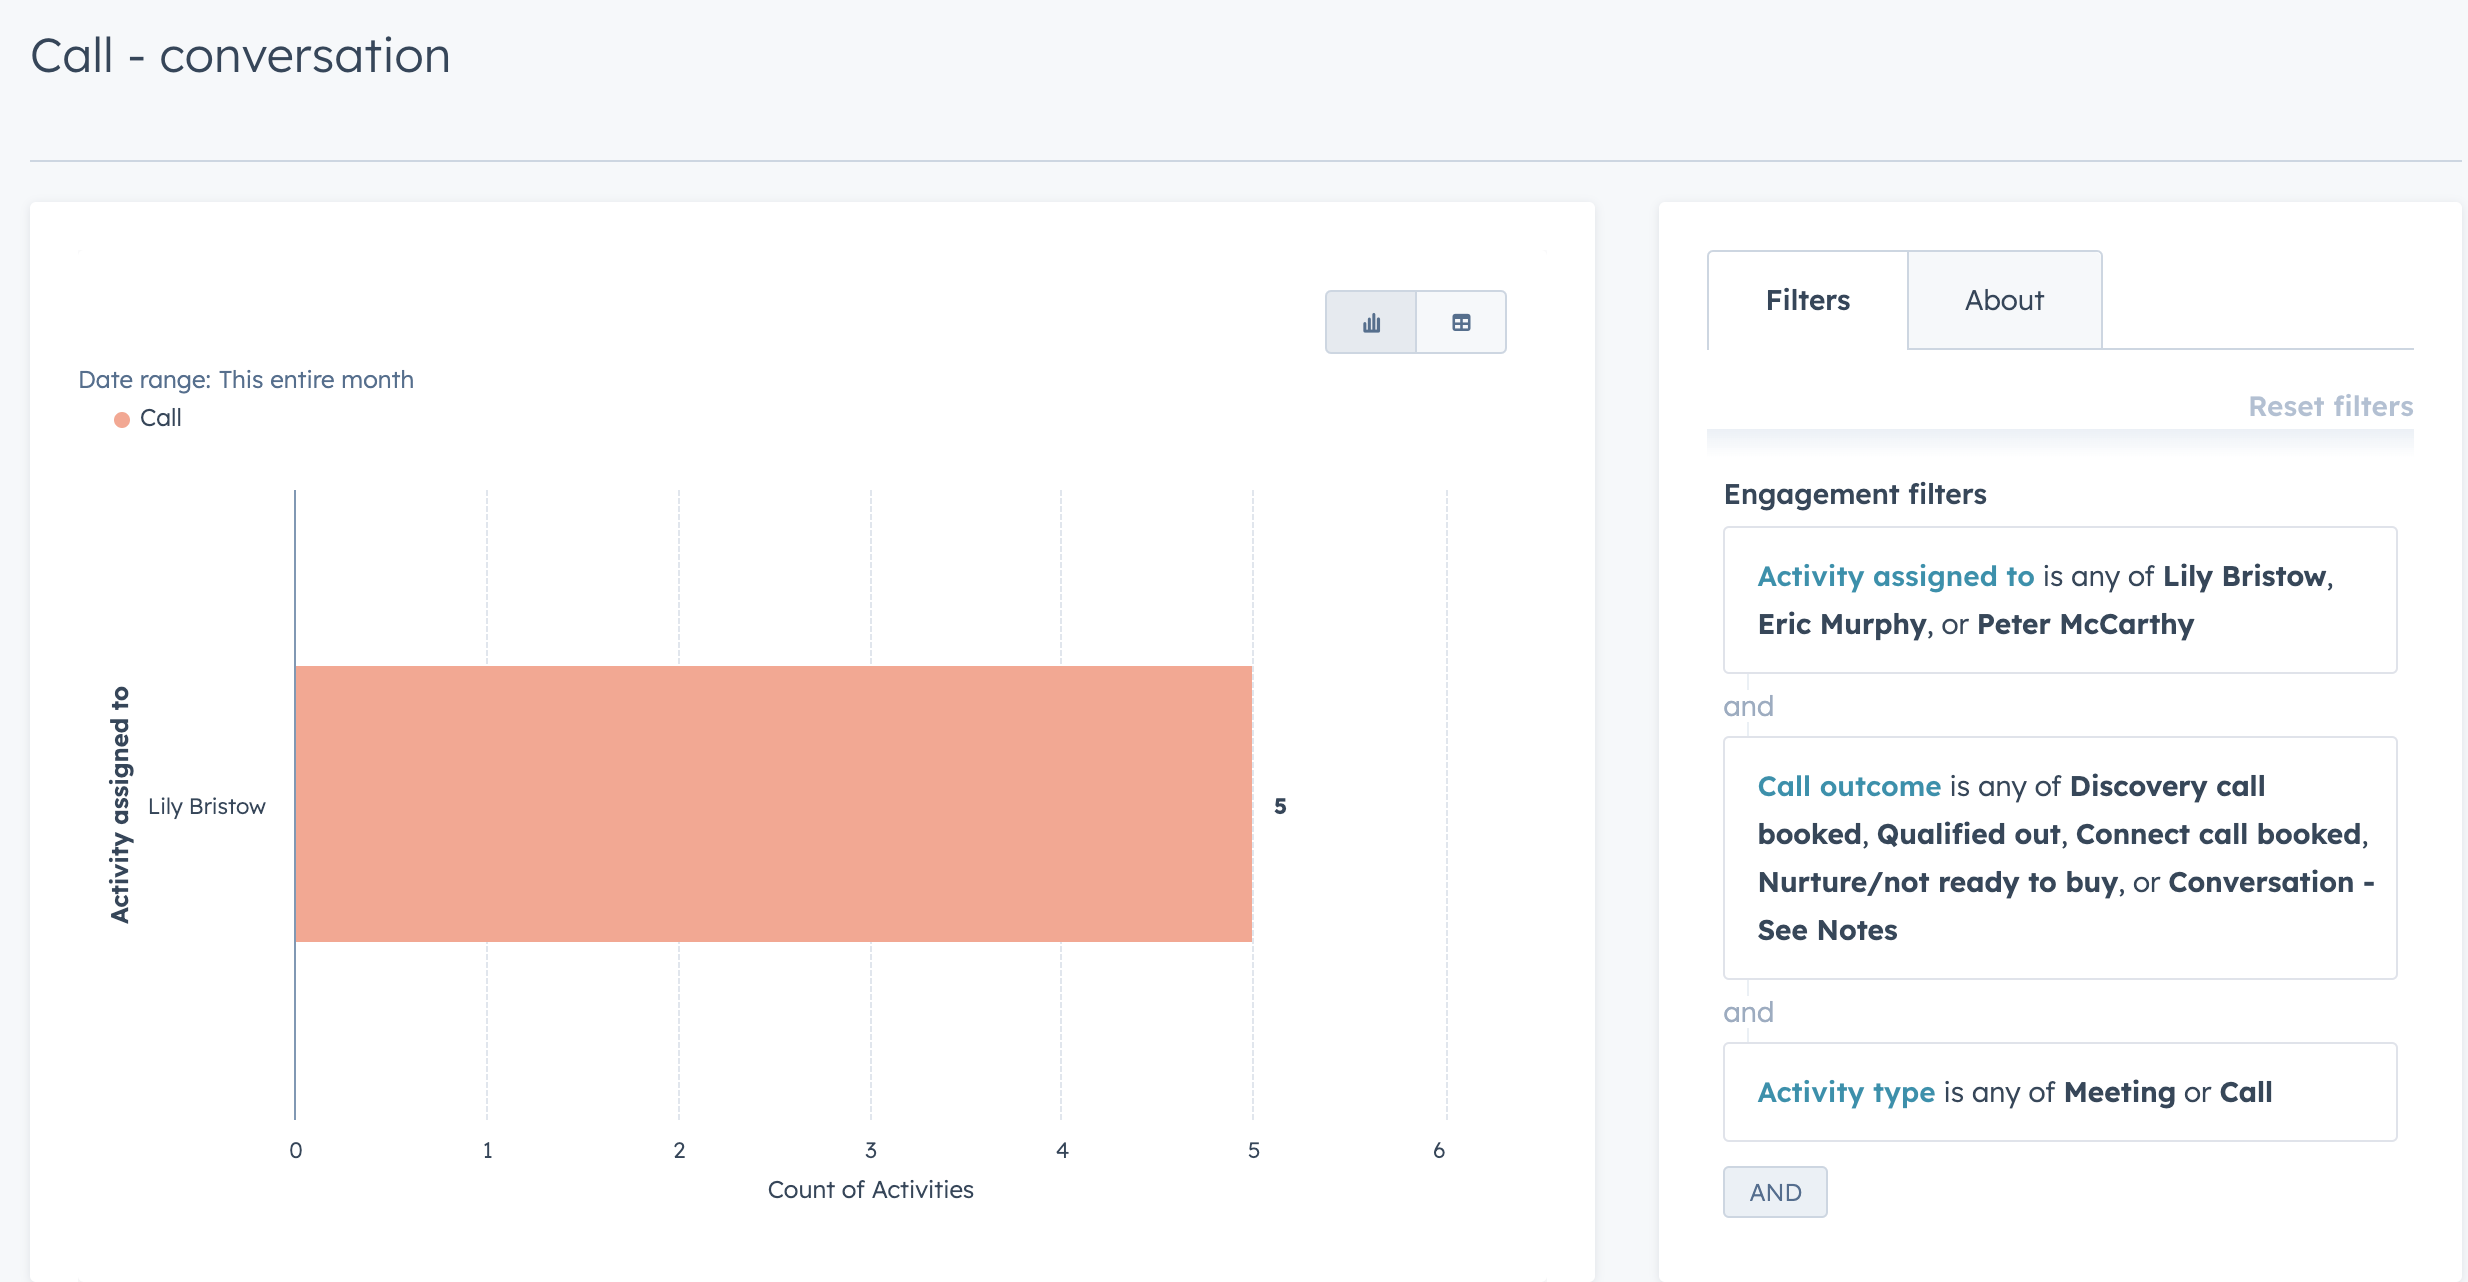
Step three: Conversation conversion report
In this report, we are tracking the number of meaningful conversations had by a sales rep after the initial call.
- Clone report from step two
- Customise report
- Click filters > click and
- Select Call outcome > add your selection of options. This will depend on your business and what you have already set up within your call outcomes. Example below.
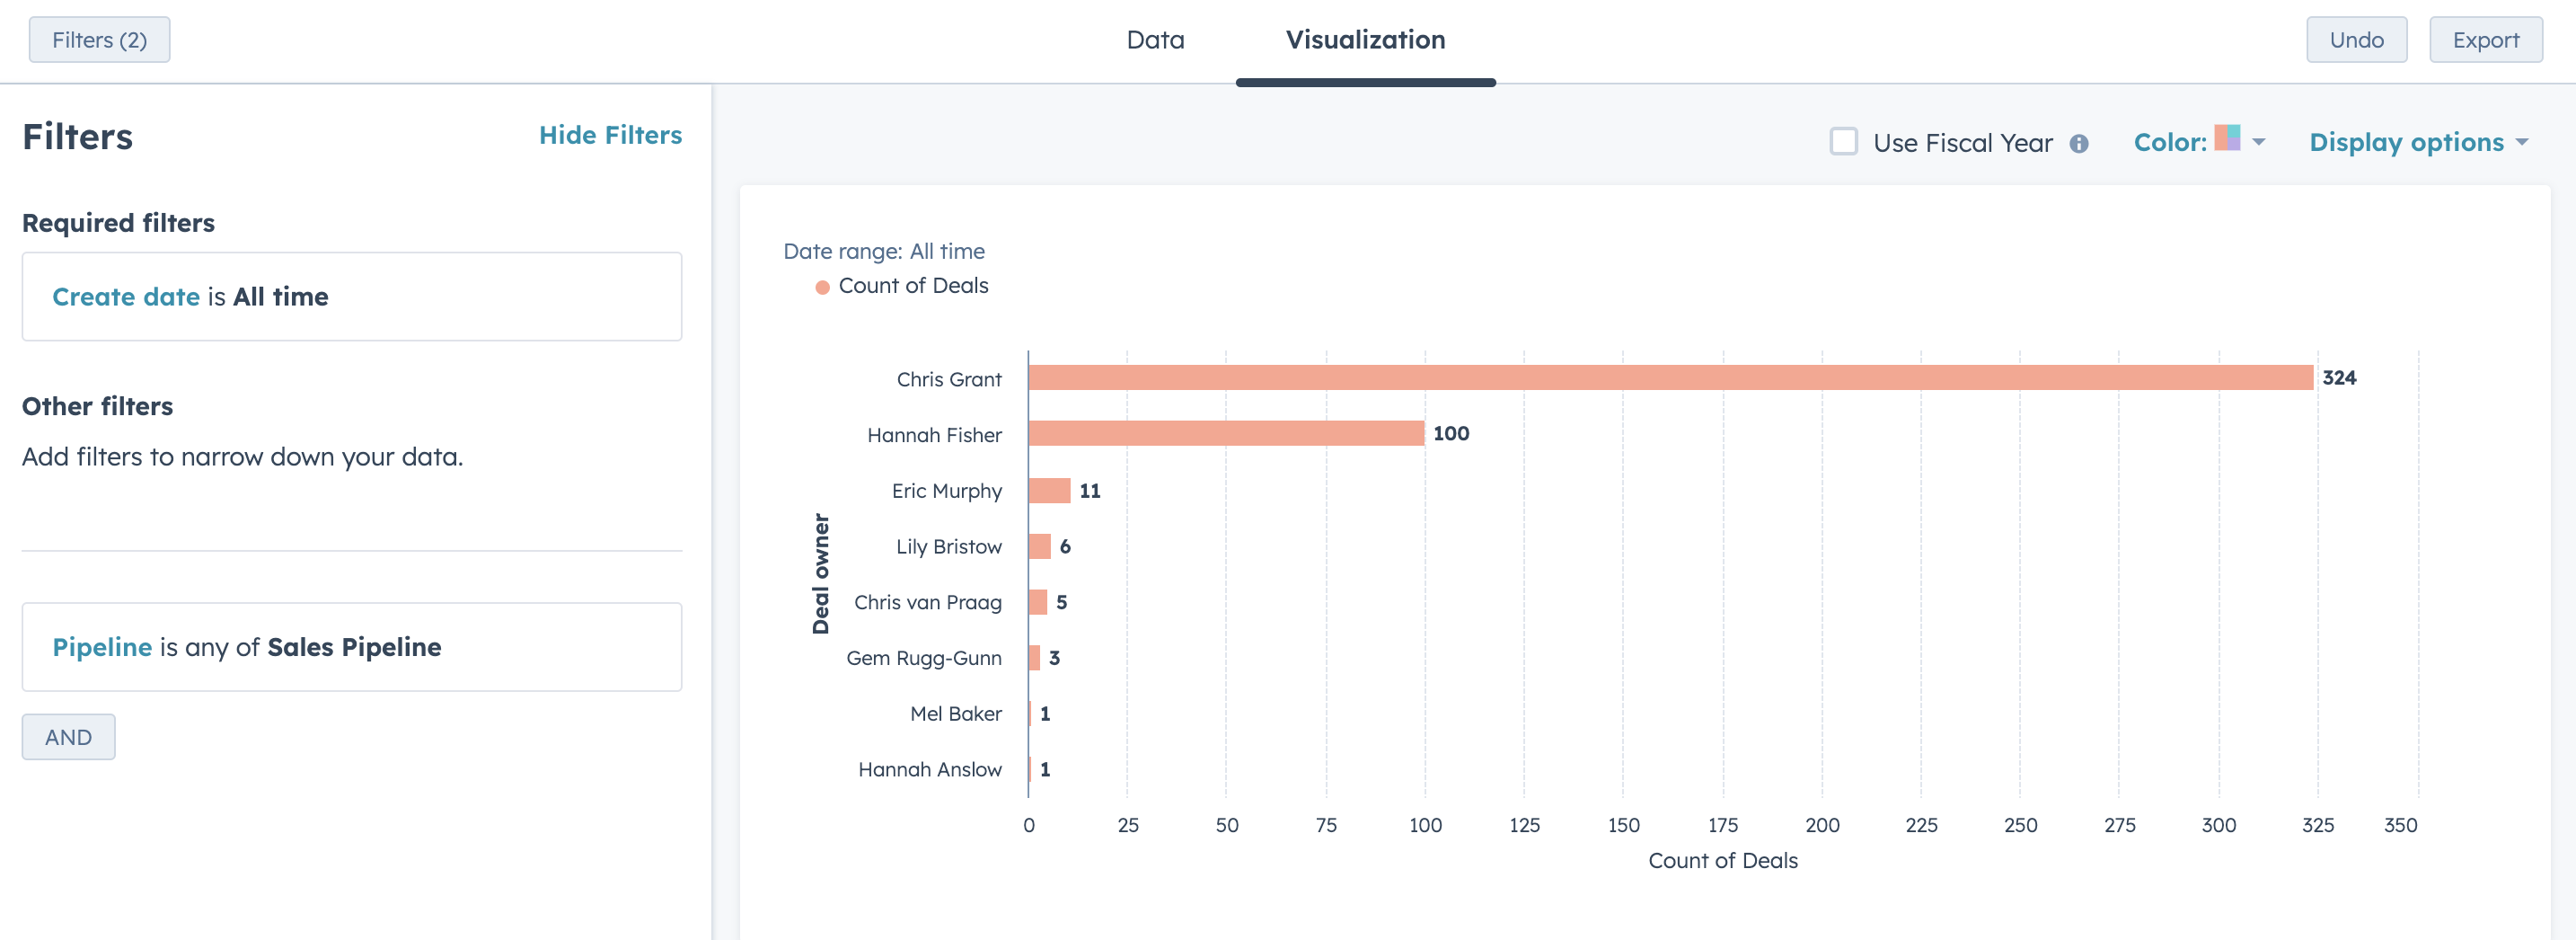
Step four: Conversion rate from conversations to open deals
In this report, we are tracking the number of open deals created by a sales rep after the discovery/connect call.
- Click create report > Single object > Deals
- Add deal property > Deal owner
- Click visualisation
- Display deal owner and count of deals
- Click filters > add filter > pipeline > add selection. This will depend on your business and what you have already set up within your deal pipeline. Example below.
Step five: Conversion rate from open deals to close
- Clone report from step two
- Customise report
- Add filters > call and meeting type > add selection. This will depend on your business and what you have already set up within your call and meeting types. For example, we recommend having one set up titled "Sales - Closing".
Step six: Add more reports to build out a better view
The above four reports are the minimum that should be included but we would recommend adding:
- Deals closed won by rep
- Deal revenue by rep
- Deals closed lost by rep
- Deals forecasted and then closed lost by rep
- Tasks overdue by rep
- Meetings and calls total broken down by type
- Meetings book with rep
- Target accounts by sales activity
With all of these reports, you can create a powerful dashboard for sales representatives, offering real-time visibility into their sales activity, insights into conversion rates, guidance on call structures, and the opportunity for self-supervision. By leveraging these features, sales reps can enhance their productivity, improve their communication and outreach strategies, and take ownership of their performance and success.

Author: Bridget Pyne
Principal Marketer
