

With the correct approach (and the right tools), reporting can prove the value you're delivering and help you to improve the results you and your team are delivering, month after month.
There are three main benefits to really nailing your inbound marketing reporting:
- It can help you to calculate ROMI and prove this to the rest of the business
- You are able to plan what to do next, based on your performance analysis and the trends it has highlighted
- Set up correctly, reporting enables the wider business to forecast revenue, vital for investing wisely, scaling safely and surviving in times of hardship.
For most of us, sitting back and ignoring reporting is just not an option. At the very least, it will mean that you aren’t doing your job properly, because you don’t know what works and what doesn’t.
What can marketers do to really get their heads around reporting and prove the impact all their great work is having?
Looking for help with HubSpot?

What kind of inbound marketing reporting do you need?
Take the time to figure out the best approach for understanding your business data.
There are many possibilities out there, so you need to decide what would actually be useful for you.
Using a platform like HubSpot multiplies your opportunities for reporting, because it ties together the whole buyer’s journey.
4 free HubSpot reporting tools you should already be using
There are a range of reporting tools already in your HubSpot application that you could be using today. Here’s a recap:
- Your dashboard is made up of series of reports, giving you an overview of different areas of the application - from visits and conversions to your email click rate.
- Campaigns. Hidden away behind ‘productivity’ in the navigation is a fantastic tool that gives you insight into the progress of a specific campaign. Make sure that you’re assigning everything you do (social media messages, emails, landing pages, blog articles) to a campaign to ensure this insight is as comprehensive as possible. You can even set goals to make sure you keep on track.
- Page performance gives you a very simple way of seeing which pages are gaining the most views and conversions. You can even filter by timescale and type of pages (blog posts, landing pages, web pages) to be more specific.
- Sources is quite possibly my favourite and most used tool. It offers a graph view of traffic to your site (for any timeline you specify) broken down by origin. You can even drill down into each source to see campaigns or referring websites.
...or go big with the HubSpot Reporting Add-On
You may have heard of the HubSpot Reporting Add-On and could be forgiven for wondering what else it could add to the array of tools already included in your current plan.
There’s one word for that: contextual marketing. Think of it as a way of taking your current marketing dashboard and supercharging it. Your dashboard will look the same, you just have more capabilities. The add-on offers a vast range of possibilities, mainly so that you can tailor it to the specific needs of your business.
At first, the Reporting Add-on can seem a little overwhelming. So if you’ve recently bought it, or have started the free trial, I want to give you an overview of the add-on, and how you can get started.
HubSpot Reporting Add-On explained
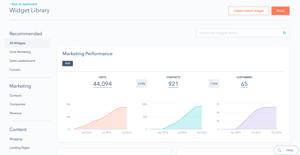
Each of the different reports on your dashboard is a widget. Enabling the Reporting Add-on means that this dashboard becomes customisable.
There's a huge range of pre-loaded report templates that you can use, whether you’re looking for an overview of your contact lifecycle funnel or average days to close.
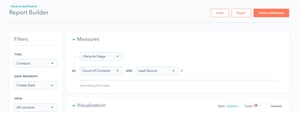
If you can’t find what you need, there is always the option to create a custom widget specific to your needs.
You can also edit your dashboard view by segmenting the data by date.
Aligning your inbound marketing strategy with sales
This is something we strongly advocate, as it's crucial for understanding the whole journey of your buyer, and really placing them at the centre of what you do.
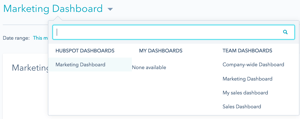
The Reporting Add-on makes this alignment easier, as it can be used by both marketing and sales. There is the option to create multiple dashboards with different types of widgets, meaning that the marketing and sales teams could have their own dashboards, but then also share one to see the process tied together. Sales and marketing alignment at its best.
Don’t worry, there are options to alter the visibility of dashboards, so you can have them accessible for the whole team, or keep them private if you need to.
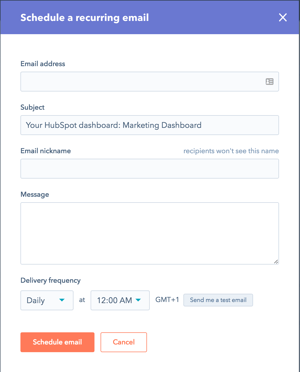
If there are people in your company who need to see regular reports, set up an automated email for the relevant dashboard to keep them updated. It will save the time of all concerned each month, and takes the hassle out of your reporting.
If you have a weekly inbound sales and marketing meeting, set up an automated report to arrive in the inbox of everyone attending at the start of the meeting with updated metrics and visuals.
7 steps for making the most of the HubSpot Reporting Add-on
1. Decide on a question that you need answered. Make sure that it is relevant and useful across the business, then decide the key metrics needed to track it. Knowing exactly what you need to know will make creating reports much easier, so don’t skimp on this stage.
2. Understand how you will segment. Do you really want to look at everyone in your database for every report, or do you only need to look at people who requested a demo, for example?
3. Once you know how you’re segmenting, make sure you’re using forms to collect relevant information from those people. You may want to assign a certain persona to those who fill out specific forms.
4. Use HubSpot CRM to get deep, granular insights based on sales activity or deal stage. Considered alongside your marketing data such as source and first conversion, and you have a powerful view of the whole process that you won't get elsewhere.
5. Create a list based on your chosen segments. Lists are your new best friend.
6. It’s at this point that you want to create your reports. Having everything set up beforehand will make it much easier to pull together the reports in the add-on. Reporting off of smart lists has never been easier.
7. Set up emails to send regular reports. This will boost your productivity and help you to develop a routine, as you won’t be having to start from scratch each time.
I spoke to Alex Hanbury, a Reporting Add-on Specialist at HubSpot, to reveal his tips for making the most of the tool
Insider tip #1. Get creative. The Reporting Add-on is a great way to report on any custom properties you are using, both at the contact and deal level. Interested in reporting on something that doesn’t come out of the box? Simply create a custom field and you’ll have no problem bringing those new insights into the add-on.
Insider tip #2. Be open. Many of the templates in the Reporting Add-on will give you ideas for reports that you may not have thought about before - but may be very valuable to you and your team.
Are you confident in your ability to accurately report on campaigns?
Reporting doesn’t have to be a big headache; it’s all in the planning. By understanding what you need to know, and thinking about the best way to find that out using segmentation of your database, you’re well on the way to having a dashboard of useful reports.
As with everything in the world of inbound, you will always need to schedule in time for iteration, and reports are no different. Just because you’ve thoroughly thought them through doesn’t necessarily mean they will instantly work exactly as required. You may need to tweak them for clarity, or you may find that the metrics you decided to follow at first aren’t quite right.
Follow the seven steps each time, and it won’t be long before you're finding it much easier to get your reports out the door.
To learn more about the importance of reporting and how you can use data iteration to drive repeatable, scalable revenue growth for your business, download our free, 80-page ebook now.

Heading


%20(1).jpg?width=50)
.png?width=50)

.png?width=50)
.png?width=50)


